Silisocs Visual Direction
Silisocs uses one presentation system across Studio, backend viewers, Plotly
figures, Matplotlib exports, and self-contained reports. The implementation
source of truth remains src/silisocs/design/; these images are references, not
runtime assets.
Direction
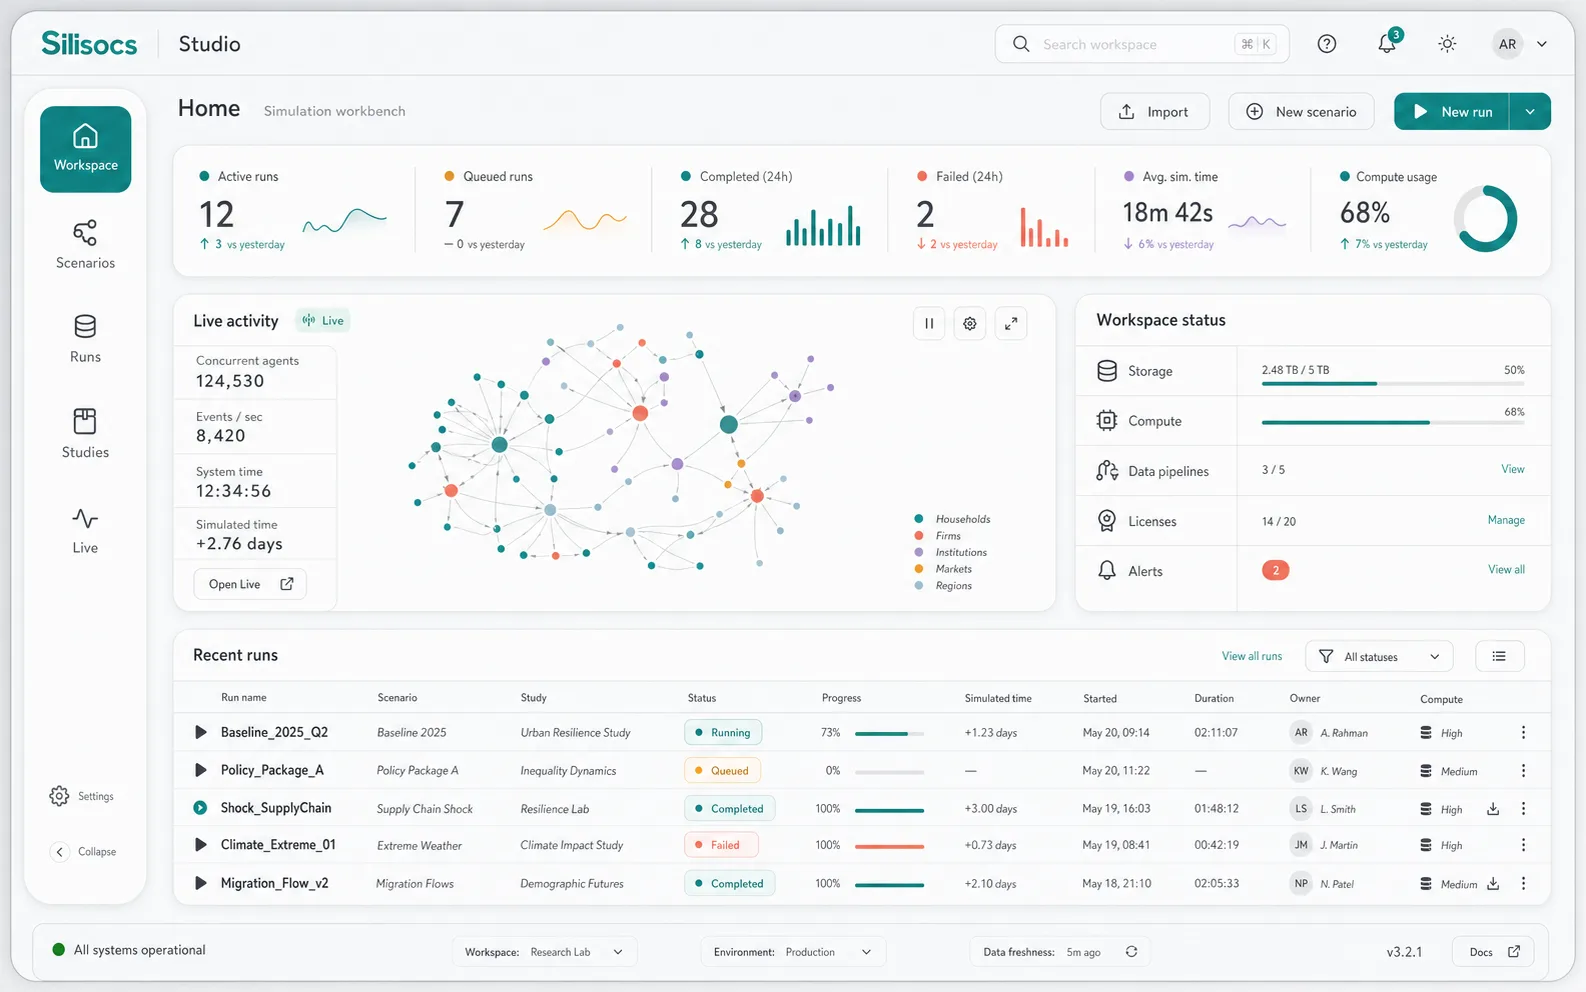
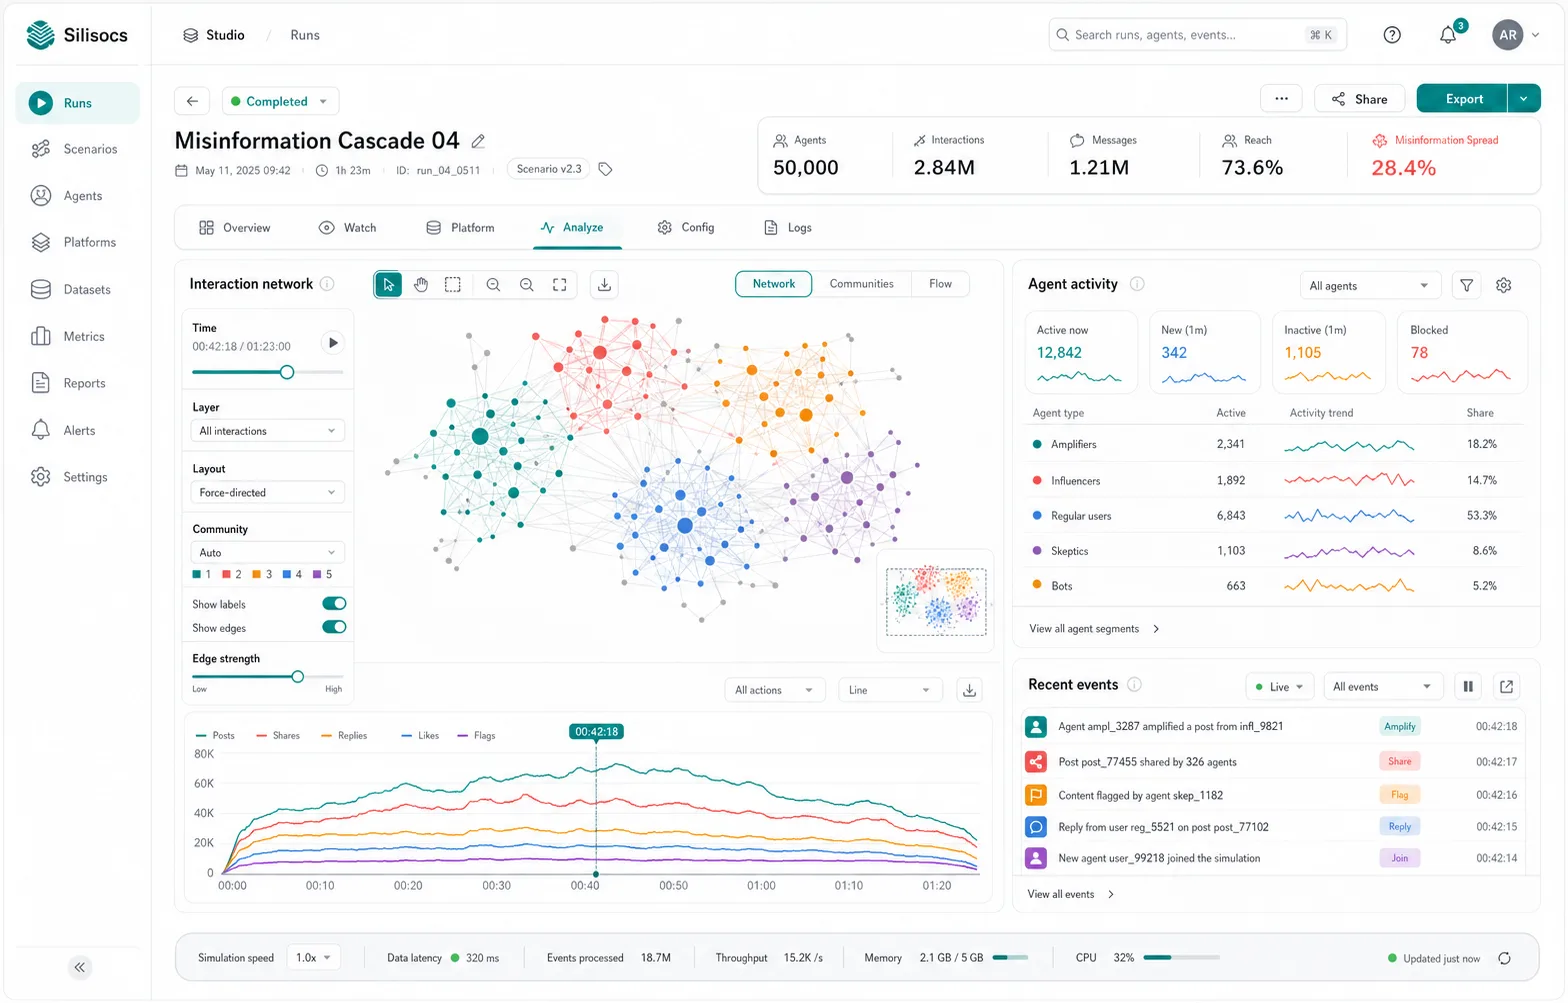
The implemented system takes the references' useful structural ideas without copying their imagined product features:
- rounded floating application chrome with 18px primary and 13px control radii;
- Manrope variable typography bundled locally and embedded in exported reports;
- cool neutral work surfaces with teal for interaction and coral, violet, sky, and amber for simulation signals;
- restrained elevation plus borders for hierarchy;
- multiple categorical colors for data, never backend-name-specific colors;
- dense, scannable layouts rather than marketing-page composition.
Backend viewers keep their domain-specific information architecture. They share only the product identity, structural tokens, responsive shell, and common interaction states.
Studio's home screen is an observatory rather than a dashboard: real indexed runs form an interactive field, pointer and keyboard focus reveal artifact metadata, and every node links to the underlying run. Archive and editor surfaces stay quieter so repeated work remains efficient.